4

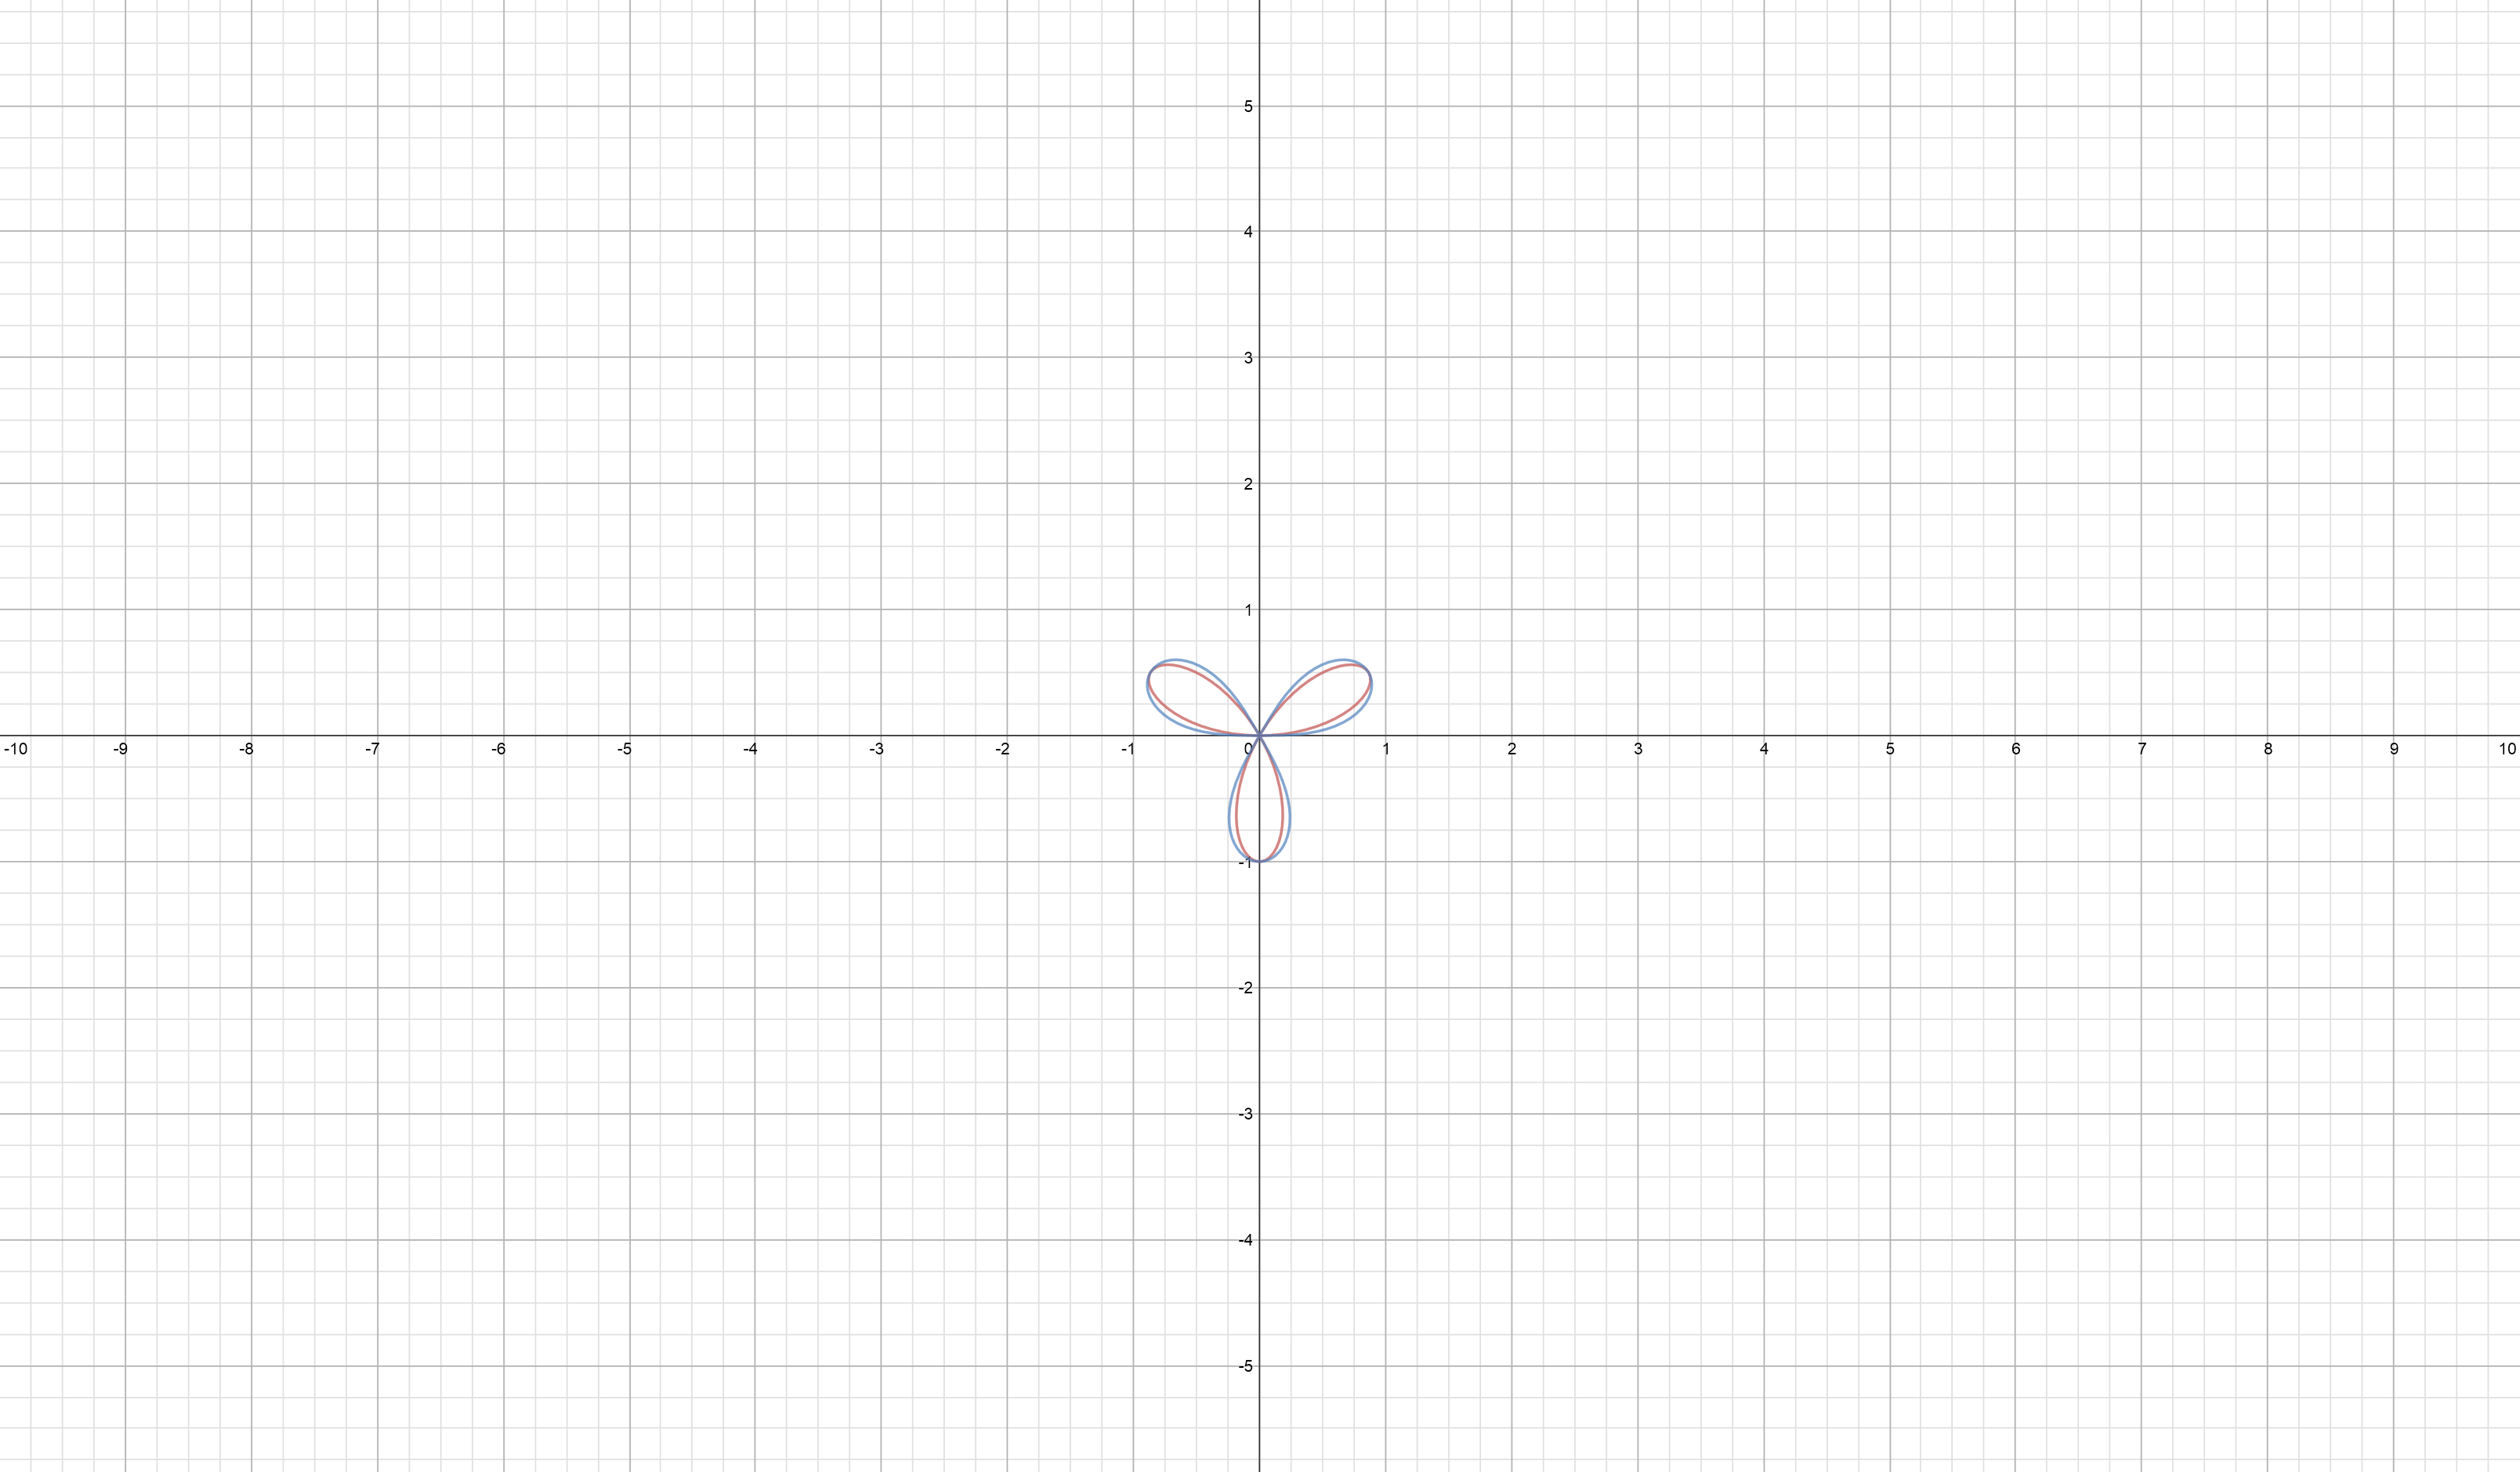
When I plot a polar plot of $r=\sin (3 \theta)$, and $r=\sqrt{\sin (3 \theta)}$ I get nearly identical graphs, both $3$ pedal rose type plots. In the case without the square root, it is easy to understand the plot. However, for the plot involving the square root of $\sin 3 \theta$, it is strange to me how the graph would handle thetas for which the $\sin$ of the $3 \theta$ is negative. It would seem that the negative values inside the square root should cause the 2 graphs to be dissimilar, yet it appears this is not the case.

Example: For $\theta = 65^\circ, r=\sin (3 \theta) = -0.259$; I would expect this it be an issue with the graph of $r= \sqrt{\sin (3 \theta)}$. Enclosed are images of the graphs of the 2 polar plots. URL for 2 graphs --> 2 polar plotshttps://s3.amazonaws.com/grapher/exports/gtwzzdokst.png

user163862
  • 2,043

2 Answers2

6

These images might give you a better sense of things. Very often, the nature of a parametric plot is best understood as a path drawn as the parameter changes, instead of just a static set of points that satisfy a relation.


You'll notice that the $r = \sin 3\theta$ curve draws smoothly, actually plotting "backwards" through the pole for values of $\theta$ (for instance, $90^\circ$) when $r$ is negative.

enter image description here


On the other hand, the $r = \sqrt{\sin 3\theta}$ curve "pauses" as $\theta$ sweeps through values that make the radicand negative. (The red flashing is Mathematica expressing its frustration at being asked to plot imaginary values. Normally, I'd suppress that; however, here, it's actually directly relevant to the discussion, so I left it.)

enter image description here

Blue
  • 75,673
  • It's worth noting that the $r=\sqrt{\sin 3\theta}$ curve plots only non-negative $r$ values. This is because the square-root function itself never returns negative values. On the other hand, a related curve, $r^2 = \sin 3\theta$ would plot both a positive and a negative $r$ value for a given $\theta$, effectively creating a six-petal rose by drawing "positive" and "negative" three-petal roses simultaneously. – Blue Jan 31 '15 at 02:21
  • 1
    Very, very useful. thank you very much!!! – user163862 Jan 31 '15 at 18:25
  • 1
    very useful indeed, thank you – Thor Feb 19 '19 at 01:57
2

Notice that if you plug in $r=|\sin\:(3θ)|$ instead of $r=\sin\:(3θ)$ you get a six-petal graph. The concept of a negative radius doesn't make much sense, so in reality the negative results of $r=\sin\:(3θ)$ are just not being drawn either.

BHT
  • 2,215
  • 2
    The concept of negative radius does make sense in polar coordinates; you just look the the exact opposite way through the pole. (So, the point with polar coordinates $(-1,\theta)$ is identical to the point with polar coordinates $(1,\pi + \theta)$. This is just like complex numbers, and it's one of the things that makes polar graphs so cool. :) The "negative" portions of $r=\sin 3\theta$ are indeed being drawn, only "backwards" through the pole; as a result, they overlap the "positive" portions. (Continued.) – Blue Jan 31 '15 at 01:19
  • 2
    (Part 2) However, the concept of an imaginary radius doesn't make sense in this context, so in graphing $r = \sqrt{\sin 3\theta}$, the grapher is skipping-over the angles at which the radicand is negative. This is not unlike graphing $y = \sqrt{x}$; a grapher simply draws nothing for $x < 0$. If you can find a grapher that allows you to see the graph being drawn as a path as $\theta$ increases, the dynamic here becomes more clear. – Blue Jan 31 '15 at 01:22