0

Background

I am trying to produce a table of values for the positioning of the hands of a clock at any time, limited by one second intervals, to demonstrate the feasibility of an ultra precise, digitally rendered analogue clock.

One integer unit is 1 number on the face of the clock, i.e. 1 through 12 arranged in the classical way of a circle with equal, 30 degree angles between numbers.

The hour hand ticks 1 integer unit every hour, in increments of 1/3600ths
The minute hand ticks 1 integer unit every 5 minutes, in increments of 1/300ths The second hand ticks 1 integer unit every 5 seconds, in increments of 1/5ths

Thus at 01:05:05, the hands approximately overlap, but I need to know the uncertainty.

The Problem

Is there a way to calculate, using excel, the relative difference between the 3 values in a way that I can then sort the data to find the positions where the hands are closest to overlapping (to then analyse the uncertainty)?

I do not wish to know where the hands cross, my data already tells me that much.

To illustrate

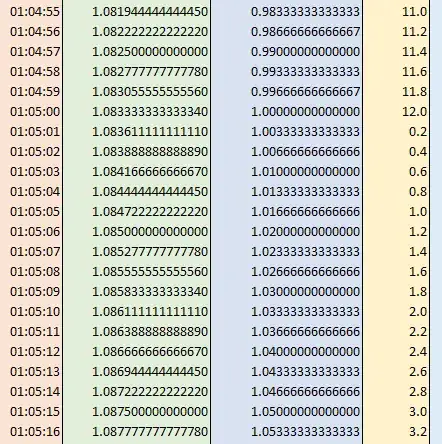
To make things a little clearer, here is my data.

I want to find out how close each second row is to overlapping, relative to every other row.
Such as:-

00:00:00 would be a perfect overlap, call the result of this 0.

01:05:05 is a very close overlap, call the result 0.005 relative to 00:00:00.

03:45:30 is nowhere near an overlap, call that result 0.99 relative to 00:00:00.

Ideally '0' is a perfect overlap. '1' is the point at which each hand is equidistant from the others.

I want to quantify the fact that the overlap of the 01:05:05 hands is far closer than the 01:04:55 value in the table for instance.

It is clear to see, due to the values at 01:05:05 being all very close to 1, whereas the values at 01:04:55 have a larger difference between the hour/minute and the second hands, and so are not as close to overlapping.

Thanks in advance

Jamie W
  • 57
  • You want to know the uncertainty of what? And what do the three columns represent? – awllower May 08 '15 at 14:33
  • The uncertainty due to the limitations of engineering when trying to achieve these precision's. But that is irrelevant to the question. – Jamie W May 08 '15 at 14:36
  • @awllower I understand the question is horribly worded but I cannot personally think of a better way to word it. – Jamie W May 08 '15 at 14:38
  • You want to know something that is irrelevant here? Well, I doubt that... And what do the three columns in the table represent? – awllower May 08 '15 at 14:42
  • @awllower Each row is one second. The red is the time represented by the row. The green is the hour hand position in terms of it traveling 1 through 12 over a 12 hour period. Blue is the minute hand position in terms of 1 through 12 over 1 hour. The yellow is the second hand position in terms of 1 through 12 over 1 minute. – Jamie W May 08 '15 at 14:46
  • OK, but, if this is a question about the uncertainty in computer calculations, why post in a site about mathematics? I still don't seem to understand what you are asking, sorry. – awllower May 08 '15 at 14:50
  • Avoid the comment about uncertainty. I want to calculate where the hands overlap the closest, using my table of values. That is all. I am using excel but that is where the relevance of computers in this question cease. @awllower – Jamie W May 08 '15 at 14:54
  • I know the overlaps, I want to find out how close each second row is to overlapping, relative to every other row. Such as:- 00:00:00 would be a perfect overlap, call the result of this 0. 01:05:05 is a very close overlap, call the result 0.005 relative to 00:00:00. 03:45:30 is nowhere near an over lap, call that result 0.99 relative to 00:00:00. Ideally '0' is a perfect overlap. '1' is the point at which each hand is equidistant from the others. – Jamie W May 08 '15 at 15:06

1 Answers1

0

It appears your units are $30^\circ$. You can find the minimum angle that will cover all three hands, so at $0:00:00$ the angle is $0$, at $1:05:05$ it is $0.0847222$, at $1:05:03$ it is $1.024166$ and so on. There are subtleties caused by going past $12$. For example at $1:05:00$ you would want $1.0833333$, not $11$ What I would do is sort the positions so that they are $a,b,c$ with $a \le b \le c$ One angle that covers the hands is $c-a$. Another is $b-(c-12)$. A third is $a-(b-12)$. Take the smallest of these. The worst case is $8$, when the hands are equally spaced around the circle, so divide by $8$ to get a result in the range $[0,1]$

Ross Millikan
  • 374,822