For a successful simulation you need three things. First, a well-defined measure of what is important, here 'sitting close'. Second, a way to way to model
what you mean by random behavior, here 'unbiased seating, not influenced
by gender'. Third, an automated way of computing the measure, so that
you can run many iterations on a computer without having to do the evaluation
by hand.
To give a simple illustration, suppose we consider positions of boys and
girls along a row of a dozen seats. One measure of closeness or 'clumpiness'
of seating might be runs.
Runs as a measure: If there are 6 boys and 6 girls, then the
smallest number of runs is two: BBBBBBGGGGGG or GGGGGGBBBBBB, for maximum
clumpiness. And the largest number of runs is 12 BGBGBGBGBGBG or
GBGBGBGBGBGB for minimum clumpiness.
Random scrambling: One possibility would be to have equal numbers of boys and girls,
as above. On a computer it is easy to scramble 6 boys and 6 girls at random.
In order to use numbers in stead of letters, use 1's for girls and 2's for boys.
In R statistical software the sample function will easily make random
arrangements or permutations: We start with a vector kids containing six
1's and six 2's. Then we repeatedly permute them using sample.
kids = rep(1:2, each=6);  kids
## 1 1 1 1 1 1 2 2 2 2 2 2
perm = sample(kids, 12); perm
## 1 1 2 2 2 1 2 1 2 1 2 1          # 1st random permutation
perm = sample(kids, 12); perm
## 1 2 2 2 2 1 2 1 1 1 1 2          # 2nd random permutation
perm = sample(kids, 12); perm
## 1 1 2 1 2 2 1 1 2 2 2 1          # 3rd
perm = sample(kids, 12); perm
## 1 2 2 1 1 2 2 1 1 2 2 1          # etc.
perm = sample(kids, 12); perm
## 1 2 1 2 2 2 1 2 2 1 1 1
Automatic counting of runs: In R the function rle (for Run Length Encoding)
will find the runs in a permutation and count the length of each run. Here is
an example for one permutation.
perm = sample(kids, 12); perm
## 1 1 1 2 2 1 1 2 1 2 2 2
rle(perm)
## Run Length Encoding
## lengths: int [1:6] 3 2 2 1 1 3
## values : int [1:6] 1 2 1 2 1 2
The translation is that we have six runs in this permutation:
The first run consists of three 1's, the second run consists of two 2's,
the third of two 1's, and so on.
We can capture the lengths and values as follows:
info = rle(perm)
info$lengths
## 3 2 2 1 1 3
length(info$lengths)
## 6                     # number of runs
max(info$lengths)
## 3                     # length of longest run
mean(info$lengths)
## 2                     # average run length
A simulation: We can put this altogether to find the 'typical behavior'
of runs of six boys and six girls sitting at random in a row of 12 seats.
At the beginning we make vectors nr and mx to receive the results
of 10,000 scramblings of 12 kids. The actual numbers are put into these
vectors one at a time as the program goes through the 'for' loop.
m = 10000;  nr = mx = numeric(m);  kids = rep(1:2, each=6)
for (i in 1:m)  {
   perm = sample(kids, 12)
   info = rle(perm)
   nr[i] = length(info$lengths)
   mx[i] = max(info$lengths)    }
mean(nr);  mean(mx)
## 7.0126
## 3.1963
So when six boys and six girls sit at random in a row of 12 seats
without regard to gender, there will be about 7 runs, and the longest
run will be about 3.
We can make histograms of the simulated numbers
and maximum lengths. It is probably easiest to interpret run lengths. It seems that if there are fewer than 3 or 4 runs
when real groups of 6 girls and 6 boys sit in a row, then there may be
clumping together of genders. And if there are more than 10 or 11 runs,
then boys and girls may be tending to 'pair up'.
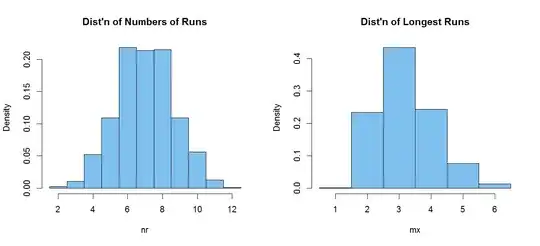
Histogram code, in case you want it:
par(mfrow=c(1,2))
 hist(nr, prob=T, br=(min(nr):(max(nr)+1))-.5, col="skyblue2", main="Dist'n of Numbers of Runs")
 hist(mx, prob=T, br=(min(mx):(max(mx)+1))-.5, col="skyblue2", main="Dist'n of Longest Runs")
par(mfrow=c(1,1))
Notes: (1) There is a lot of theoretical information about the distributions
of numbers of runs and run lengths in intermediate-level probability and mathematical statistics books. You might get some worthwhile information from Wikipedia and university sites.
(2) A larger number m of iterations will give more precise results.
The program runs fast enough on today's laptops that more extensive
simulations are feasible.
(3) R is free software available at www.r-project.org.


