GRAPH The following links are a graph question dealing with percents on a GRE Quant practice test.
Here are the figures I am given:
https://jasper.kaptest.com/content/media/07/341107.3.gredi105_17a.png
https://jasper.kaptest.com/content/media/07/341107.3.gredi105_17b.png
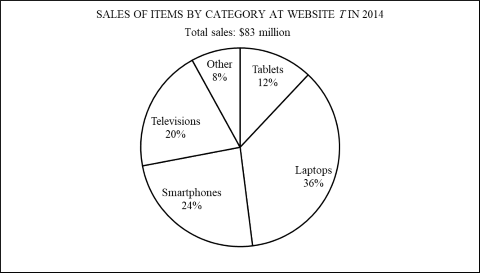
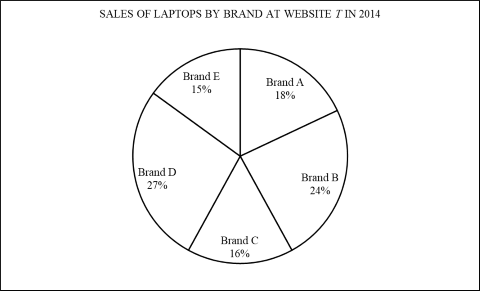
This paragraph is below both figures: "The first circle graph gives the percent distribution of products sold by a website in a given year. Total sales were $83 million. The second circle graph breaks out the percent distribution of just laptops sold in the same year by brand; this graph gives no total number of laptops."
THE QUESTION "In 2014, sales at website T of every product other than tablets were approximately how much greater than the sales from tablets?"
ANSWER $63.1 million
EXPLANATION The task is to find the approximate difference between the sales of tablets in dollars and the sales of all other products. The sales of different products appear in the first graph. Tablets are 12% of the total, so all other products are 100% – 12% = 88% of the total. Because both percents are of the same total, the difference in sales is 88% – 12% = 76% of the total sales.
MY QUESTION Why do we subtract 12 percent from 88 to receive our answer?
PS I know that .76 * 83 (million, in sales) == the answer.
Thanks.