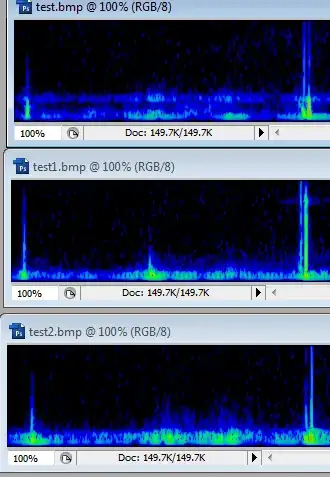
I have 3 visually similar graphs pictured below. They have similar peak patterns that are visible to the naked eye, but I want to compare their similarity mathematically.
I can sum each column to flatten the intensity present, giving you a line curve so the intensity need not be a factor necessarily.
I'm not sure what domain/strategy I should be looking at. I want to essentially measure the similarity of the curves, but since amplitude can vary to some extent, I'm not sure how that would be accounted for, and I'm frankly a bit out of my depths here and don't know exactly where to look.
Any help in direction would be most appreciated.