I have a set of data points which distribute around a semicircle. How can I fit a semicircle on that distribution in MATLAB? The data has two columns (X Y) and a number of rows (varying for different experiments).
Asked
Active
Viewed 2,208 times
1
-
Is it a simple semicircle you expect to be center at an origin and aligned with the $x$ or $y$ axis, or is it with respect to an arbitrary coordinate system? – Ron Gordon Feb 06 '13 at 14:17
-
How do you plan to measure the fit, the error of approximation by a semi-circle? – hardmath Feb 06 '13 at 14:27
-
@rlgordonma: It is a distribution of points (result from a simulation). The distribution is in the form of a semicircle as I expected. But, to proceed, I need to fit the data points with a semicircle. The data has two columns X and Y (position coordinates). – aneps Feb 06 '13 at 14:31
-
What I was asking was, is there a function form for the fit, i.e. $y(x) = y_c + \sqrt{r^2-(x-x_c)^2}$, or will you need to introduce a coordinate rotation as an additional parameter? – Ron Gordon Feb 06 '13 at 14:37
2 Answers
3
One simple way would be to use the function fminunc which does unconstrained minimization.
Let's say you have data $x_i$ and $y_i$. Your hypothesis is that the fit on a circle, that is,
$$x_i^2 + y_i^2 = r^2 + \epsilon_i$$
where $r$ is to be determined. You can fit the radius by minimizing the sum of squared errors
$$S(r) = \sum_{i} e_i^2 = \sum_i (x_i^2 + y_i^2 - r^2)^2$$
and the optimal $r$ is the one which minimized this:
$$r^* = {\rm argmin}_r S(r)$$
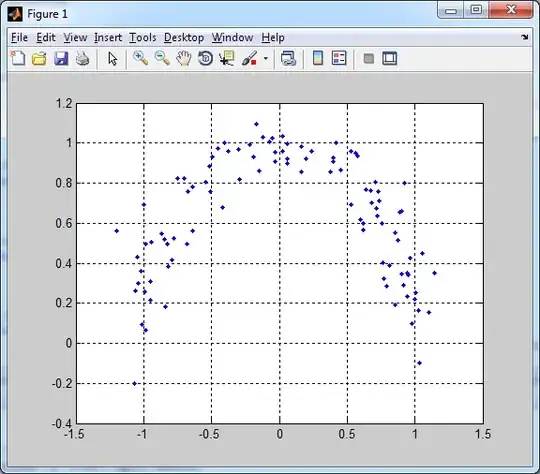
First let's generate some data on a semicircle:
theta = pi * rand(100,1);
x = cos(theta) + 0.1 * randn(100,1);
y = sin(theta) + 0.1 * randn(100,1);
You can plot this and make sure it looks as you expect:
plot(x,y,'.'), grid on
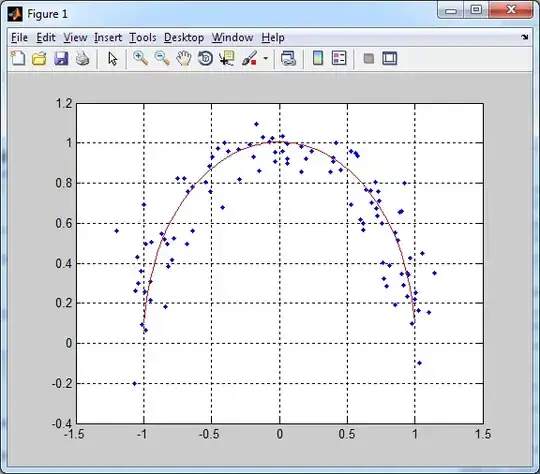
Now you can find the radius that minimizes the error using fminunc. We expect the answer to be about 1, but we'll put 2 as our initial guess, so that the minimizer has to do some work:
r_opt = fminunc(@(r)sum((x.^2 + y.^2 - r^2).^2), 2);
And now you can plot this on top of your previous plot, to make sure it looks sensible:
hold on
xvals = linspace(-1,1,100);
plot(xvals, sqrt(r_opt^2-xvals.^2), 'r')
Chris Taylor
- 28,955
-
what if the data are not centered at the origin, or even parallel to an axis? – Ron Gordon Feb 06 '13 at 14:38
-
1
0
A straightforward method to fit a circle to a data set and obtain the value of radius and the coordinates of the center is given pages 12-13 in the paper "Régressions coniqiues, quadriques,..." published on Scribd :
JJacquelin
- 66,221
- 3
- 37
- 87