-1

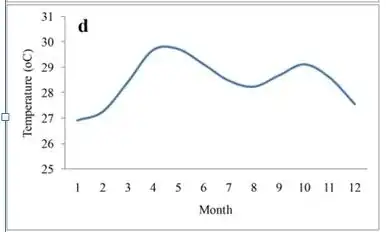
I want to generate seasonal temperature of Bay of Bengal. I want to do this with a trigonometric function. Seasonal temperature of Bay of Bengal has two peaks. One major peak during April and another moderate peak in November. Which trigonometric function I should use to do this?

enter image description here

Arthur
  • 199,419
Ecology
  • 21

2 Answers2

1

The standard way to model periodic function is with Fourier series (though in your case the function seems approximately periodic only).

A simple second order approximation would be

$$a+b\cos\omega t+c\sin \omega t+d\cos 2\omega t+e\sin 2\omega t$$ where $\omega=\dfrac{2\pi}{12}$ if $t$ is in months.

You can find the extrema by canceling the derivative,

$$-b\sin\omega t+c\cos\omega t-d\sin2\omega t+e\cos2\omega t=0.$$

The coefficient $a$ will be the annual average and the remaining coefficients can be found by giving the positions and amplitudes of the two maxima, and solving a linear system of equations.
0

If I understand correctly you want to interpolate the temperature using trigonometric functions given a set of known data points. For this you can use trigonometric interpolation.

Note that such an interpolation is not unique since your entire dataset consists of two points (the peak temperatures). You might want to add a lot more points if you want to correctly interpolate the data.

Klangen
  • 5,075
  • Actually, I want to generate the temperature data with the function. For example, T(t)=T+delta tsin(ot+a) can be used for generating the seasonal temperature data with one peak. I want a similar function which will generate the temperature similar to the graph I added. – Ecology Jun 04 '19 at 09:32