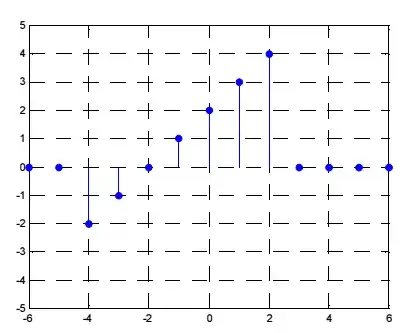
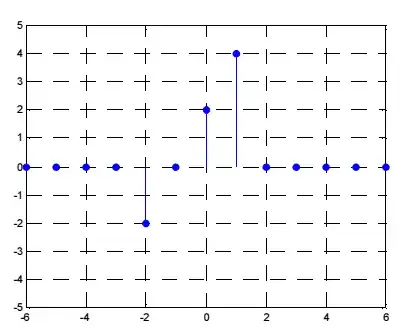
The second graph is $x(2n-4),$ not $x(2n)$. To obtain the correct graph of $x(2n)$ note that $x(n)$ is nonzero only when $n$ lies in the interval $[-4,2].$ Therefore $x(2n)$ will be nonzero only when $2n$ lies in the interval $[-4,2],$ which is to say, when $n$ lies in the interval $[-2,1].$
Let $z(n)=x(2n).$ To compute an example, $z(-1)=x(2\cdot(-1))=x(-2)=0.$ In general, the value that $z$ takes at $n$ is the same as the value that $x$ takes at $2n.$ Geometrically, this is saying that if the horizontal distance to the vertical axis of every point on the graph of $x(n)$ is halved, then one has the graph of $z(n)=x(2n).$ This results in a horizontal compression of the graph.
The graph of $y(n)=x(2n-4)$ is the the graph of $z(n)=x(2n),$ shifted four units to the right. This is what is seen in your second picture. So the rising portion of the graph of $x(n)$ occurs between $n=-4$ and $n=2.$ The corresponding rising portion in the graph of $z(n)$ occurs between $n=-2$ and $x=1.$ Finally the rising portion of $y(n)$ occurs between $n=2$ and $n=5.$