(this is simulated data without error variance)
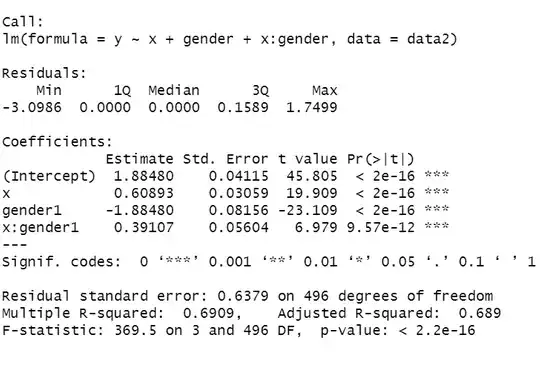
So, I have model:
y = x + gender(categorical variable, effect coded) + interaction(x and gender)
x and gender and interaction were all significant
and the plot y and x and gender.


[ 3
3
But if I see the plot, I really don't get why the interaction is significant. you can see the line is almost parallel.
would anyone help me with this?