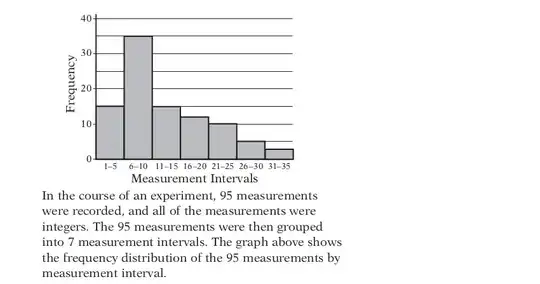
You can get both the mean and the median from the histogram. The way to calculate the mean is that illustrated in the video and already shown in one of the comments. For each histogram bar, we start by multiplying the central x-value to the corresponding bar height. Each of these products corresponds to the sum of all values falling within each bar. Summing all products gives us the total sum of all values, and dividing it by the number of observations yields the mean.
On the other hand, to calculate the median from a histogram you have to apply the following classical formula:
$$\displaystyle L_m + \left [ \frac { \frac{N}{2} - F_{m-1} }{f_m} \right ] \cdot c$$
where $L_m$ is the lower limit of the median bar, $N$ is the total number of observations, $F_{m-1}$ is the cumulative frequency of the bar preceding the median bar (i.e. the total number of observations in all bars below the median bar), $f$ is the frequency of the median bar, and $c$ is the median bar width. This formula substantially arises from a linear interpolation, which assumes that data are uniformly distributed within the median class. To understand this formula, it can be noted that the fraction $\displaystyle\frac {N/2 - F_{m-1}}{f_m}$ is the proportion of observations in the median bar that are below the median. Under the assumption that observations are uniformly distributed within the median bar, multiplying this proportion by the median bar width $c$ yields the fraction of median bar width corresponding to the position of the median. Adding this result to $L_m$ finally provides the median.
 Solution for finding mean :